


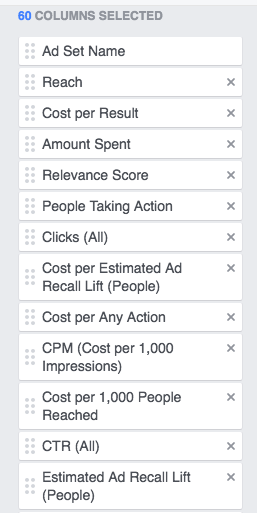
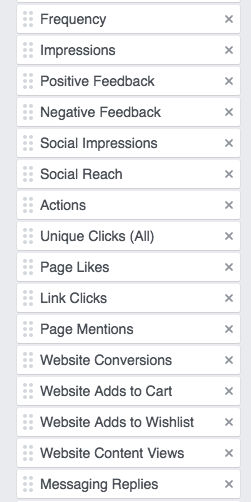
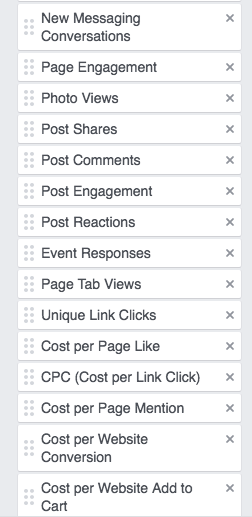
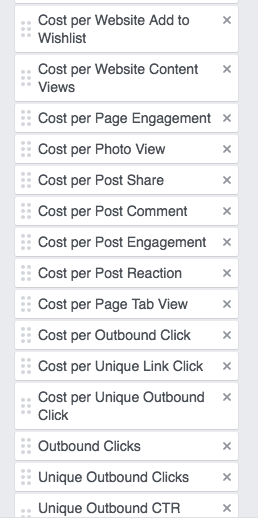
 over the past few weeks, I’ve noticed a handful of questions about which metrics are worth paying attention to in the Facebook Ads reports console.
I think there’s a good reason for this: unless you know what you’re looking for, you’re likely to spend quite a bit of time fishing around for something that can help to illuminate the impact your work is having.
It’s easy to get distracted by metrics that have little to do with your objective. It’s also quite possible to drown yourself in more information than you will ever be able to reasonably parse.
it isn’t easy to tease out the actionable information you need from the pre-built views offered in the ads manager.
I think it’s important to be able to quickly identify what content is driving what actions on the platform.
it’s also nice to have some indication of the “lift” you can expect from your efforts.
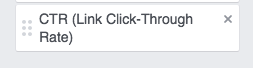
it’s helpful to separate link clicks from content clicks.
it’s good to be able to check at a glance whether delivery issues are related to problems with negative feedback or the amount spent.
understanding the rate at which a promoted post generates social activity on your page helps you to calculate the increment by which you should increase your ad budget as you scale. it can even provide insights into why your scaling isn’t going the way you expected — before you end up “lighting money on fire.”
I’d like to take the time to explain why these sixty metrics are the ones I pay attention to, but I suspect doing so will drag this post beyond a readable length, so without further ado.
Here’s How I Customize Columns.
 There are a number of circumstances where you’ll find including objective-specific metrics more valuable than the generic “website conversion,” option. If for example, you’re tracking the performance of an ad campaign in driving traffic to a custom conversion, you’ll want to pay attention to *those metrics. *The same holds true for app installs.
There’s one other trick that can prove quite helpful to identifying arrant ads when you’re looking at the way your work has delivered over time.
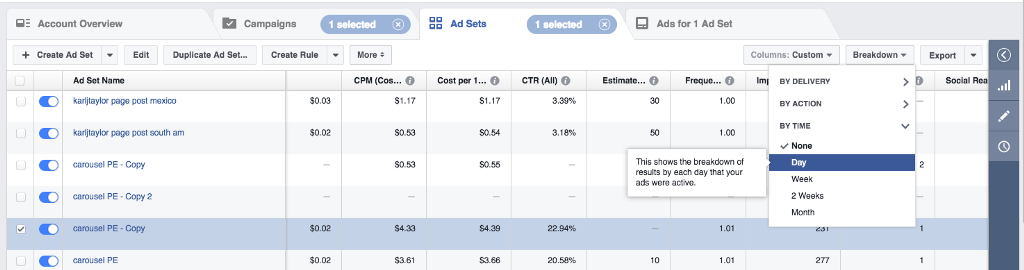 The day series breakdown is your friend.
(Fair warning: at this point the interface will get quite slow. You’ll likely want to take your data out of Facebook and into Excel to analyze further.)

Share this post
Twitter
Facebook
Reddit
LinkedIn
StumbleUpon
Pinterest
Email